We reviewed cybersecurity and business statistics from Statistics Canada, the Government of Canada, and the Ponemon Institute to identify the most relevant information for the poster.
CyberStats Challenge 2019: Highlighting Cybersecurity Issues
- Featured
- Data Visualization
Introduction
What was this project about?
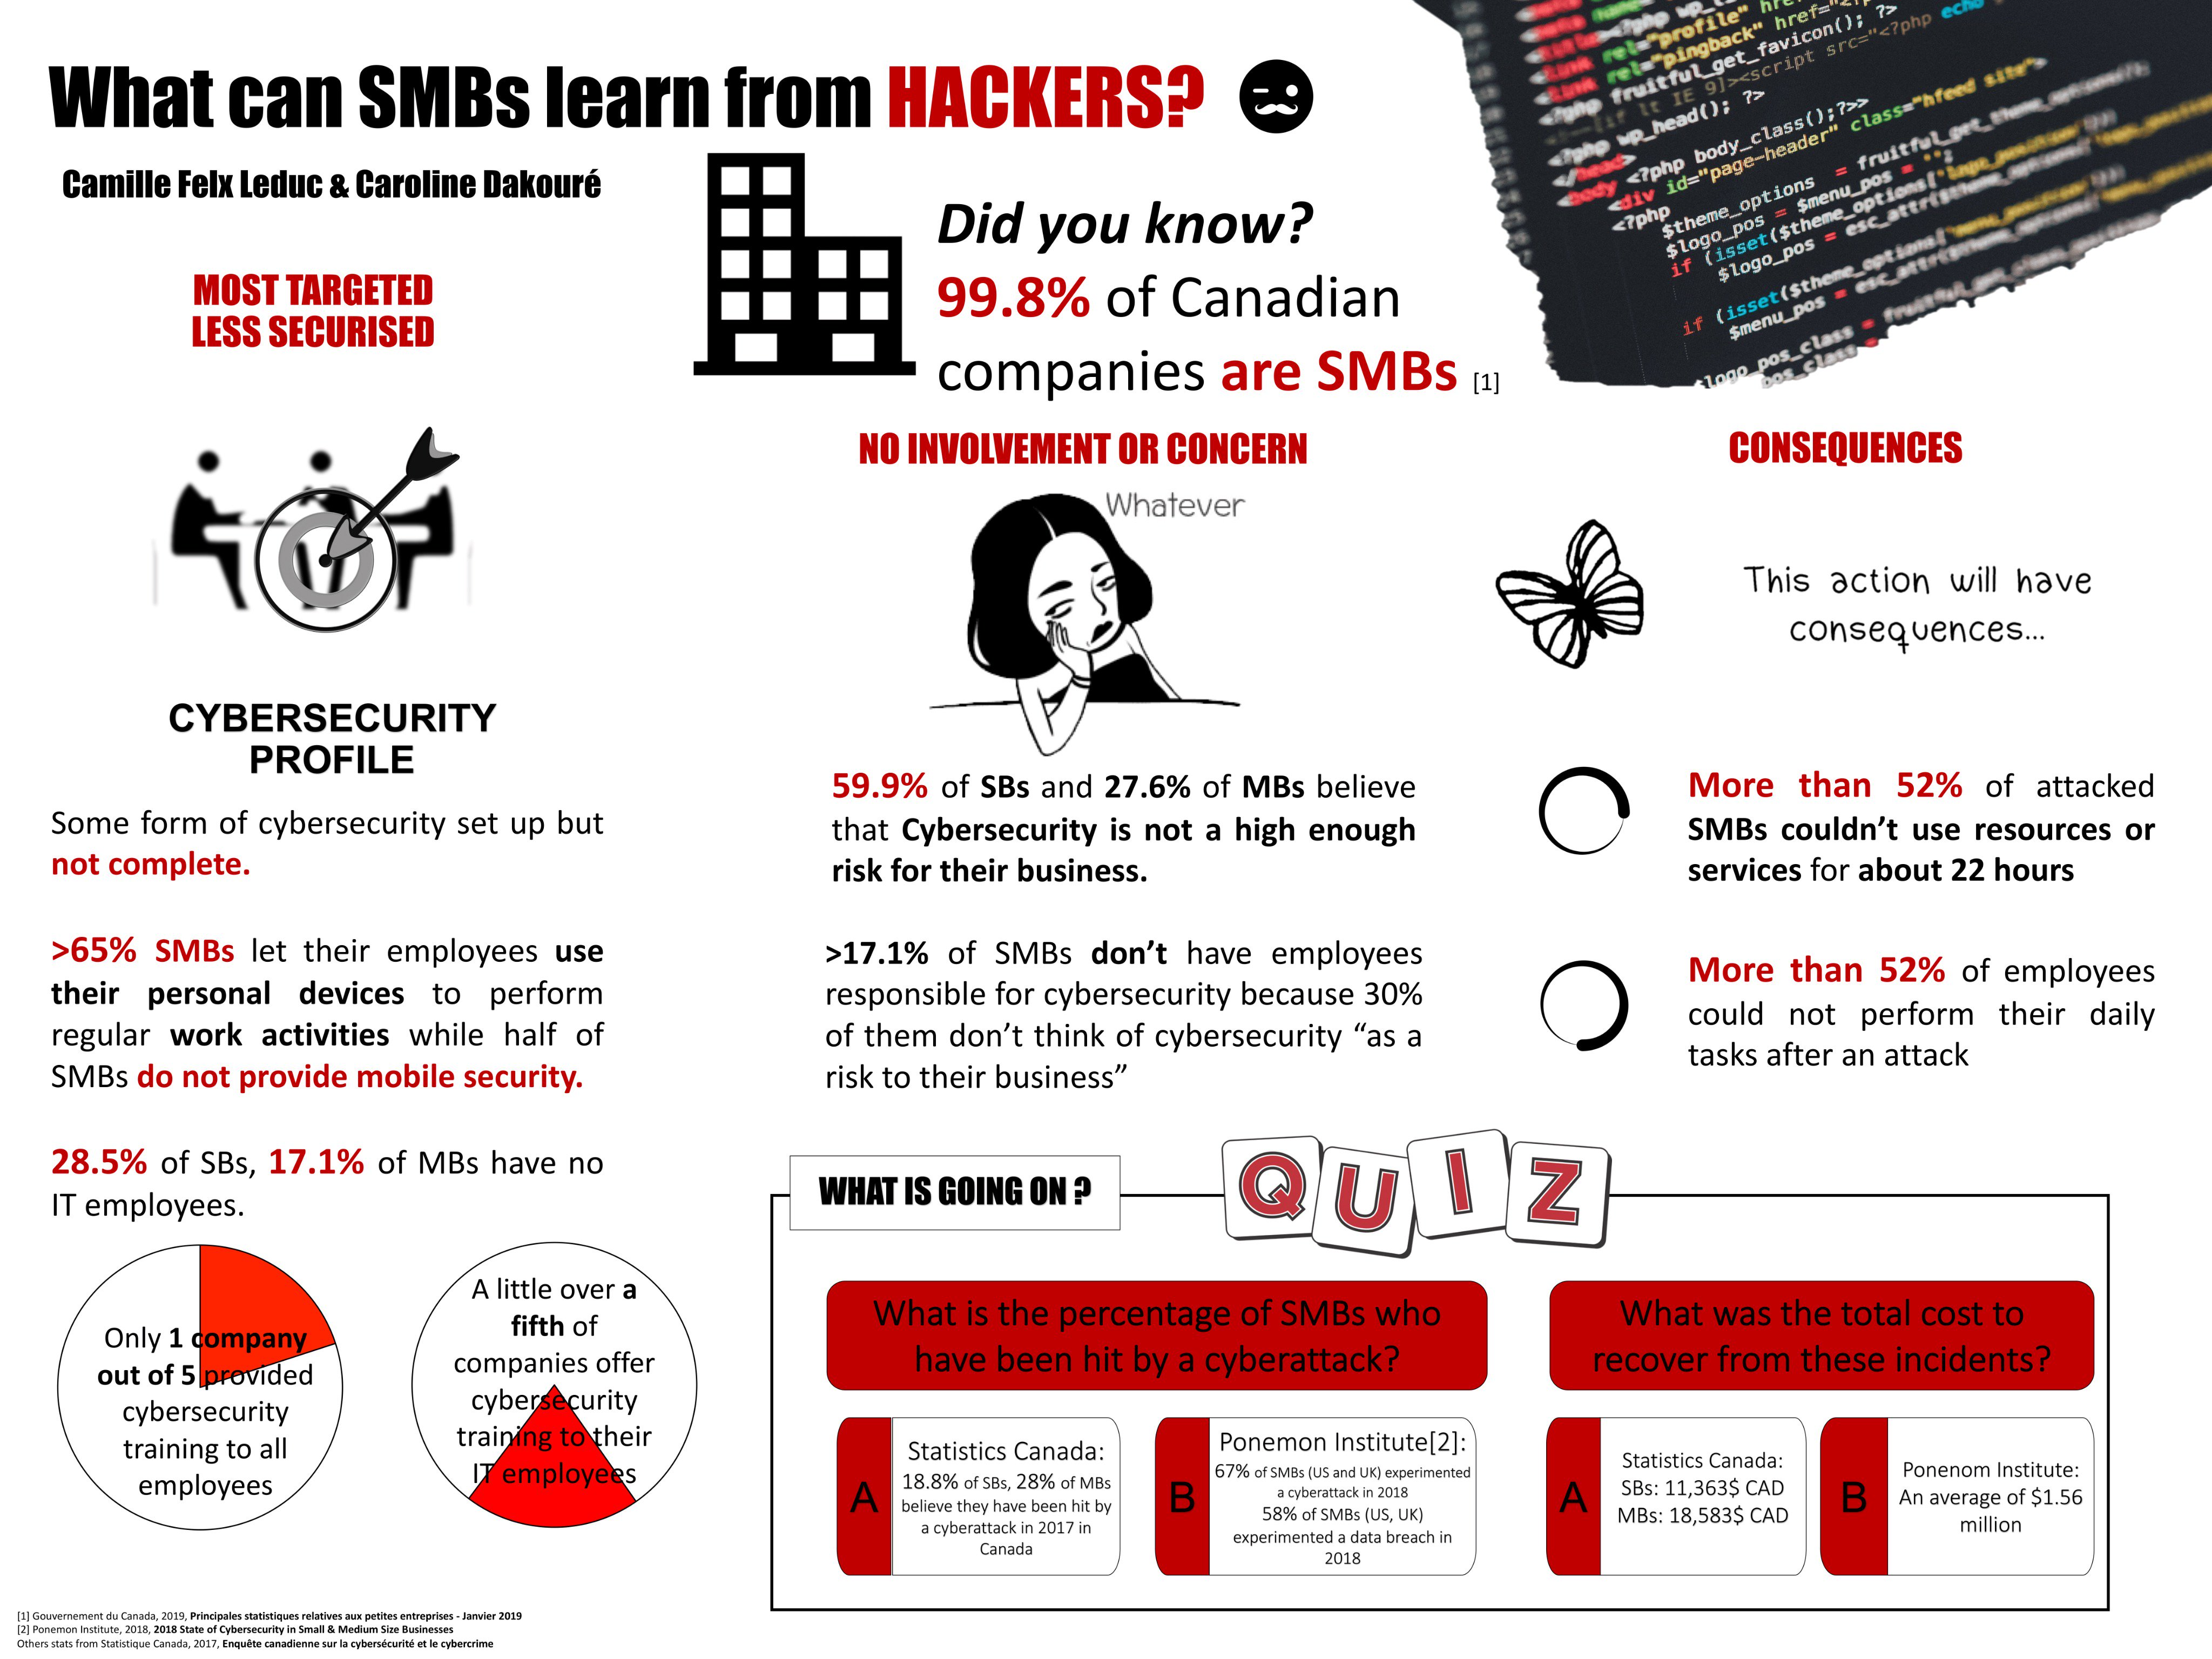
This project was created for the 2019 CyberStats Challenge organized by SERENE-RISC. Working in a team of two, we used data from Statistics Canada’s Canadian Survey of Cyber Security and Cybercrime, the Government of Canada, and the Ponemon Institute to design an informative poster about cybersecurity issues affecting small and medium-sized businesses.
My Role
I helped select and interpret the data, define the key message of the poster, and design the final visual presentation for the competition.
Technical Details
Data Sources: Statistics Canada, Canadian Survey of Cyber Security and Cybercrime; Government of Canada, Key Small Business Statistics; Ponemon Institute, 2018 State of Cybersecurity in Small & Medium Size Businesses.
Timeline
A few weeks
TL;DR
Problem
Cybersecurity and cybercrime statistics can be difficult for the public to understand at a glance.
- Small and medium-sized businesses can be vulnerable to cybersecurity threats, but the risks are not always easy to communicate clearly.
- The goal was not only to analyze the data, but to turn it into an accessible visual message.
- The poster needed to make cybersecurity statistics understandable and visually engaging for a broader audience.
Solution
We designed an informative poster to communicate cybersecurity issues affecting small and medium-sized businesses.
- We used cybersecurity and business statistics from trusted sources.
- We focused on small and medium-sized businesses because they face important cybersecurity challenges.
- We combined data analysis and storytelling to make the information more accessible.
information
Process
We selected the key statistics and shaped them into a clear visual narrative about cybersecurity issues affecting small and medium-sized businesses.
We presented our poster at the GoSec 2019 conference, where we shared our results with participants and met people from different professional backgrounds.
Impact
1st place
our poster won the CyberStats Challenge and placed first in the competition.
Science communication
the project helped translate cybersecurity statistics into a more accessible visual format.
GoSec 2019
we presented the poster at the GoSec 2019 conference, which was a motivating opportunity to exchange with people from different backgrounds.
Links
Challenge page · SERENE-RISC / Statistics Canada · Statistics Canada data release · Winner announcement